NFL Overtime Rules Fairness
Exploring the bootstrap statistical method with NFL overtime games data
Highlights
-
We evaluate the fairness of the overtime games using the bootstrap statistical method by comparing
- the probability of a game being won by a team winning the overtime coin toss, and
- the probability of a game being won by a team losing the coin toss.
-
In 90.70% of our bootstrap NFL overtime game samples (see details below), the overtime coin toss winning team has a probabilistic advantage of winning the game (i.e., the difference in probability of win if a team wins the coin toss vs. loses the coin toss greater than 0).
-
The NFL is essentially doing a randomized experiment by having teams play under different sets of rules depending on the outcome of a coin toss. When researchers conduct an experiment, they do it to test the effectiveness of some intervention or treatment. It’s not clear what outcome the NFL is aiming to test.
-
Assumption: When two teams are tied after 4 quarters of play, right at that point in time, we assume they are an equal match to each other (i.e., if the playing field were level, they both have an equal chance of winning).
Details
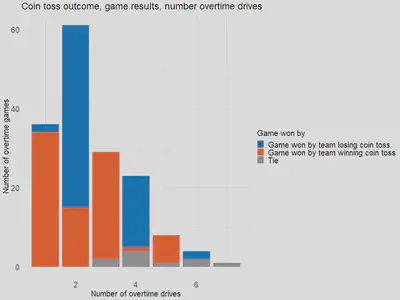
Since January 2012, 162 NFL games have gone into overtime play. In 34 of the 162 - about 1 out of 5 - of these overtime games, the unlucky team that lost a coin toss never had a chance to counter a 6-point scoring drive by the coin toss winning team. It does not sound fair when the outcome of a coin toss favors which team ultimately wins a football game. This surprisingly is a consequence of the NFL overtime rules. This post questions whether the treatment given to the coin toss winning team impacts the eventual outcome of a game.
Overtime play rules govern games that end in a tie at the end of regulation. A coin is tossed. The team winning the coin toss decides to either go on offense or defense in the opening overtime drive. Since it is not advantageous to defend the first overtime drive, the coin toss outcome essentially determines which team goes on offense first.
Overtime play rules govern games that end in a tie at the end of regulation. A coin is tossed. The team winning the coin toss decides to either go on offense or defense in the opening overtime drive. Since it is not advantageous to defend the first overtime drive, the coin toss outcome essentially determines which team goes on offense first.
A touchdown (6 points) on the first drive ends the game without the defending team getting a chance to counter. Other scenarios (2 out of the 162) that could end the game in just one drive are fumble return touchdown and interception return touchdown, each favoring the team losing the coin toss. If the first drive outcome is not a touchdown (i.e., field goal, fumble, downs, interception), any subsequent scoring or non-scoring drive that breaks the tie will end the game.
The overtime games outcome data gives us an opportunity to illustrate the utility of statistical concepts. One we will explore here is the bootstrap method that helps us make statistical inference with a small amount of observed data.
To evaluate the fairness of the overtime games, we seek to make data-based inference on the true difference between:
- the probability of a game being won by a team winning the overtime coin toss, and
- the probability of a game being won by a team losing the coin toss.
Do we see a difference in the probability of winning the game based on whether a team won or lost the overtime coin toss? If overtime game results do not depend on the coin toss outcome, we would have an equality between those two probabilities.
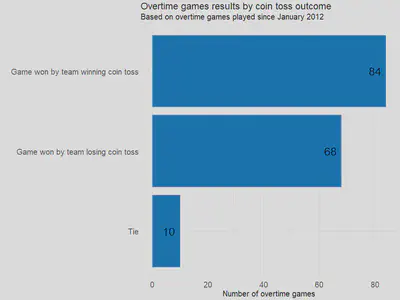
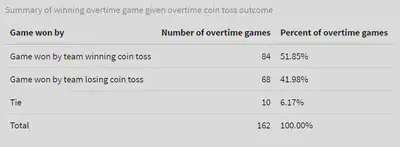
From the observed 162 games, we have the following summary statistics (also displayed in the table below):
- 51.85% of overtime games played under the current rules were won by the team winning the coin toss (i.e., the sample probability of winning a game if a coin toss was won is 0.5185), and
- 41.98% of overtime games were won by the team losing the coin toss (i.e., the sample probability of winning a game if a coin toss is lost is 0.4198).
- The above two statistics do not add up to 100% because of the 6.17% of games that ended in a tie.
A team winning the coin toss has an advantage equivalent to 0.0987 in probability of winning a game that goes into overtime. This difference between the two sample probabilities is our one-number summary estimating the fairness of the current overtime rules.
Obtaining summary statistics is just one part of statistical analysis. We are not just interested in one numerical summary stating the probability of winning a game improves by 0.0987 if a team were lucky enough to win a coin toss.
We also want to know how accurate the quoted statistic is. Had we observed the universe of all overtime games under the current rules, by how much is the team winning the overtime coin toss favored to win the game?
If the NFL is considering rule changers, how much evidence against the status quo is needed? A 95% confidence in the existence of a true game winning probability advantage due to a coin toss win? Or is it sufficient to be 72.6% confident that the true game winning advantage is greater than 0.05?
More on bootstrap method
The bootstrap is a general method for assessing the accuracy of statistics and provides robust information about the distribution of the parameter of interest. Let’s use bootstrap method to make data-based inference on game winning probabilistic advantage due to winning the coin toss. We repeat these steps sufficiently large number of times (e.g., for this analysis I repeated the steps 25,000 times)
-
Create a bootstrap sample by drawing with replacement a sample of 162 games from the originally observed 162 games. Imagine you have a bag that contains 162 paper slips each numbered with the outcome of the 162 observations. Randomly select one slip representing a game; record whether the game was won by the team winning the coin toss, the team losing the coin toss, or ended in a tie; put the slip back into the bag; repeat until you have done this 162 times. Since that the bootstrap sampling is done with replacement, a specific game could be selected multiple times in one bootstrap sample.
-
Calculate the bootstrap estimate of the edge due to the coin toss win for each of the bootstrap samples in the previous step. That is, calculate the difference between the number of games won by the coin toss winning team and the number of games won by the coin toss losing team. Then divide that difference by the number of games in each bootstrap sample (i.e., 162). Instead of just one numerical summary, we now have a large number of bootstrap estimates that can inform us of the distribution of the advantage due to coin toss win. This forms a basis for inference on the true edge winning of the coin toss affords.
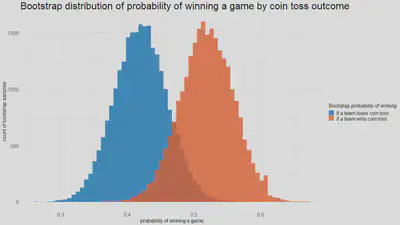
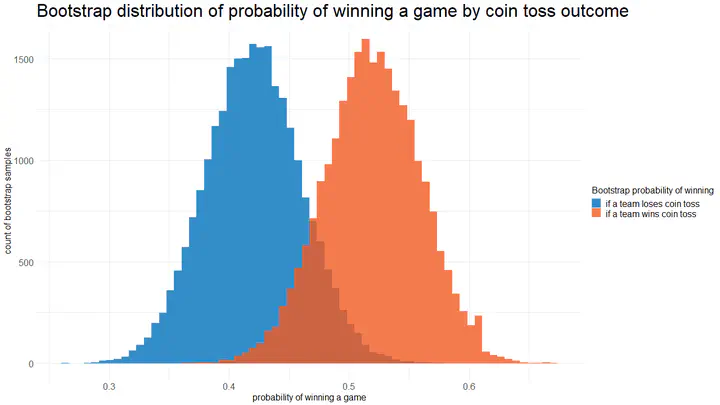
The histogram on the left side of the plot above shows the distribution of game winning probability by coin toss losing team, and the histogram on the right for coin toss winning team. The marked distributional difference between the two histograms is visually apparent, so is the area in which the two histograms crossover.
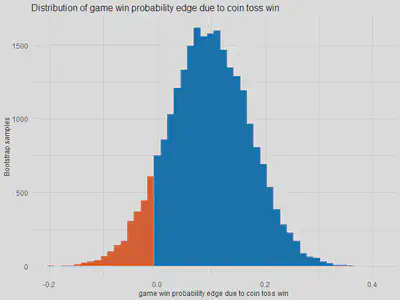
In the 90.70% of the bootstrap samples, the game winning probability advantage of a coin toss winning team is larger than 0.
Parting remarks
This article is born out of curiosity of how much advantage a random assignment leading to disparate application of rules impacts an outcome of a sports game. Football fans do not need a bootstrap methodology or any other method to validate if the current overtime play rules favor the team that wins the coin toss. Nonetheless, it does present an interesting application of the bootstrap method, and other inference techniques.
The NFL is essentially doing a randomized experiment by having teams play under different sets of rules depending on the outcome of a coin toss. When researchers conduct an experiment, they do it to test the effectiveness of some intervention or treatment. It’s not clear what outcome the NFL is aiming to test.
Bereket Kindo, PhD
Bereket Kindo’s interests include Bayesian analysis and machine learning.